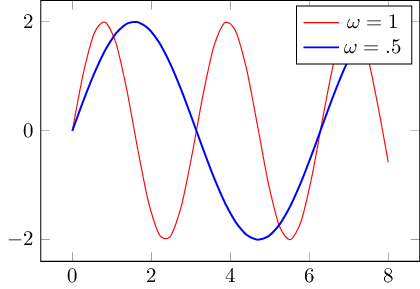
Two sine plot
A pgf diagram using custom function to plot with different parameters.
\begin{tikzpicture}[
        declare function = {
            seen(\x) = 2*sin(deg(2*\x));
        },
        mythick/.style={thick,blue}
        ]
    \begin{axis}[
        width=8cm,height=6cm,
        samples=30, smooth,
        domain=0:8,
        legend style={anchor=north east}
    ]
    \addplot[red] {seen(x)};
    \addlegendentry{$\omega=1$}
    \addplot[mythick] {seen(.5*x)};
    \addlegendentry{$\omega=.5$}
    \end{axis}
\end{tikzpicture}