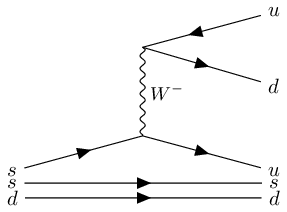
Sigma decay Feynman diagram.
A Feynman diagram showing sigma decay. I had used this diagram in One of my particle Physics homework.
\begin{tikzpicture}
    \begin{feynman}
        \vertex (a);
        \vertex [below left=.4cm and 2cm of a] (b) {$s$};
        \vertex [below right=.4cm and 2cm of a] (c){$u$};
        \vertex [above=of a] (d);
        \vertex [below right=.4cm and 2cm of d] (e) {$d$};
        \vertex [above right=.4cm and 2cm of d] (f) {$u$};
        \vertex [below=0.2cm of b] (s1) {$s$};
        \vertex [below=0.2cm of c] (s2) {$s$};
        \vertex [below=0.45cm of b] (s3){$d$};
        \vertex [below=0.45cm of c] (s4){$d$};
        \diagram*{
            (b) --[fermion] (a) --[fermion] (c),
            (a) --[boson,edge label'={\small $W^{-}$}] (d),
            (d) --[fermion] (e),
            (d) -- [anti fermion] (f),
            (s1) -- [fermion] (s2);
            (s3) -- [fermion] (s4);
        };
    \end{feynman}
\end{tikzpicture}