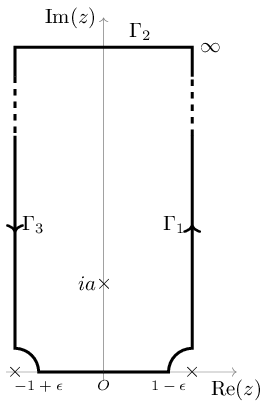
\begin{tikzpicture}[
        contourline/.style={draw,line width=1.3pt}
    ]
  \tikzmath{\R=1.5;\r=0.4;\l=5;}% Change these values to see the magic
  \draw [help lines,->] (-\R*1.1,0) -- (\R*1.5,0) coordinate (xaxis);
  \draw [help lines,->] (0,-0.1*\R) -- (0,\l*1.2) coordinate (yaxis);

  \draw[contourline]
      (0,0) node [below, font=\scriptsize] (origin) {$O$} --
      (\R-\r,0) node[below,font=\scriptsize]{$1-\epsilon$}
      arc(180:90:\r) node [below,font=\scriptsize]{} --
      (\R,0.8*\l);% node [right] {$\infty$};

  \draw[contourline]
      (\R,\l)  -- (\R,1.1*\l)node [right] (infty) {$\infty$} -- (-\R,1.1*\l) --(-\R,\l);

  %\draw (\R,\l) -- (-\R,\l);
  \draw[dashed,contourline] (\R,0.8*\l) -- (\R,\l);
  \draw[dashed,contourline] (-\R,\l) -- (-\R,0.8*\l);

  \draw [contourline]
      (-\R,0.8*\l) node [below,font=\scriptsize] {} --
      (-\R,\r) node [below,font=\scriptsize]{}
      arc(90:0:\r) node [below,font=\scriptsize]{$-1+\epsilon$} --
       (0,0);


  \node at (-\R,0) {$\times$};
  \node at (\R,0) {$\times$};
  \node at (0,\l*.3) {$\times$};
  \node [left] at (\R,0.5*\l) {$\Gamma_1$};
  \draw [->,line width=1.1pt] (\R,0.5*\l);
  \node [above right] at (0.2*\R,1.1*\l) {$\Gamma_2$};
  \node [right] at (-\R,0.5*\l) {$\Gamma_3$};
  \draw [-<,line width=1.1pt] (-\R,0.5*\l);
  \node [left] at (0,\l*.3) {$ia$};
  \node [below] at (xaxis) {Re($z$)};
  \node [left] at (yaxis) {Im($z$)};
\end{tikzpicture}
