\begin{tikzpicture}[
declare function={
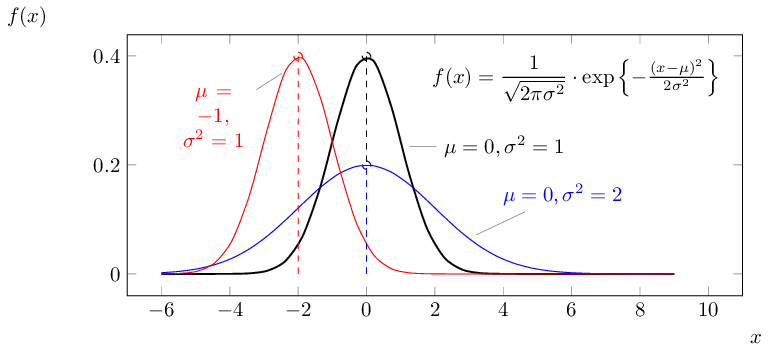
normalpdf(\x,\mu,\sigma)=
(2*3.1415*\sigma^2)^(-0.5)*exp(-(\x-\mu)^2/(2*\sigma^2));
},
hplot/.style={ycomb, mark=o, dashed}]
\begin{axis}[
width=12cm, height=6cm,
samples=30,
xlabel=$x$, ylabel=$f(x)$,
xlabel style={at={(1,0)}, anchor=north west},
ylabel style={rotate=-90, at={(0,1)}, anchor=south east},
legend style={draw=none, fill=none},
domain=-6:9,
legend cell align=left,
xmin=-7, xmax=11]
\addplot [smooth, thick] {normalpdf(x,0,1)}
node[pos=0.47, pin={right:$\mu=0,\sigma^2=1$}] {};
\addplot [smooth, blue] {normalpdf(x,0,2)}
node[pos=0.6, pin={45:$\mu=0,\sigma^2=2$}] {};
\addplot [smooth, red] {normalpdf(x,-2,1)}
node[pos=0.25, pin={[text centered, text width=8ex]
200:$\mu=-1$, $\sigma^2=1$}] {};
\addplot [hplot, samples at={0}] {normalpdf(x,0,1)};
\addplot [hplot, samples at={0}, blue] {normalpdf(x,0,2)};
\addplot [hplot, samples at={-2}, red] {normalpdf(x,-2,1)};
\node[anchor=north east] at (axis description cs: 0.975, 0.95)
{$f(x) = \dfrac{1}{\sqrt{2\pi\sigma^2}}\cdot
\exp\left\{-\frac{(x-\mu)^2}{2\sigma^2}\right\}$};
\end{axis}
\end{tikzpicture}